States across the US have been easing social distancing restrictions and re-opening their economies over the last two months. The result was a strong economic bounceback in May, with the country adding 2.5 million jobs. But with the good of economic recovery has come the bad of increased COVID spread.
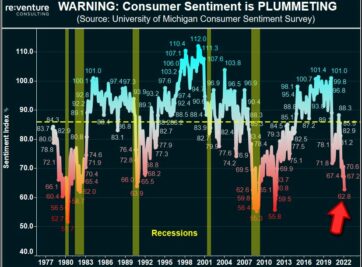
From June 19th to June 25th the US experienced a nearly 50% week over week increase in positive COVID cases. These increases put pressure on regional governments to slow re-opening measures. They also hurt consumer confidence in the areas surrounding outbreaks. Both of these factors stand to slow or reverse economic recovery.
The severity of a regional COVID outbreak is dependent on two main factors: the transmissibility of the virus (how fast it spreads) and the susceptibility of the population (case severity in those infected).
Transmissibility increases with:
Population Density
Public transport use
Susceptibility increases with:
Population age
Underlying health conditions of population
Densely packed cities with a higher share of public transport use stand to experience more virus spread. Those that have an older, unhealthier population will admit more positive cases to the hospital, straining healthcare resources.
Analyzing these variables on a metro-level could shed light on the markets most at-risk for continued COVID outbreaks and the associated economic issues that come along with them.
Transmissibility
Transmissibility is determined by the virus’ basic reproduction rate – that is, how many new infections are caused by an existing infection. Most estimates show a COVID reproduction rate around 4, meaning that one positive person could expect to infect another 4 people.
But this is just an average. Densely populated cities with heavy public transport use could have a reproduction rate of 10 while a sparsely populated rural area might be closer to 1.
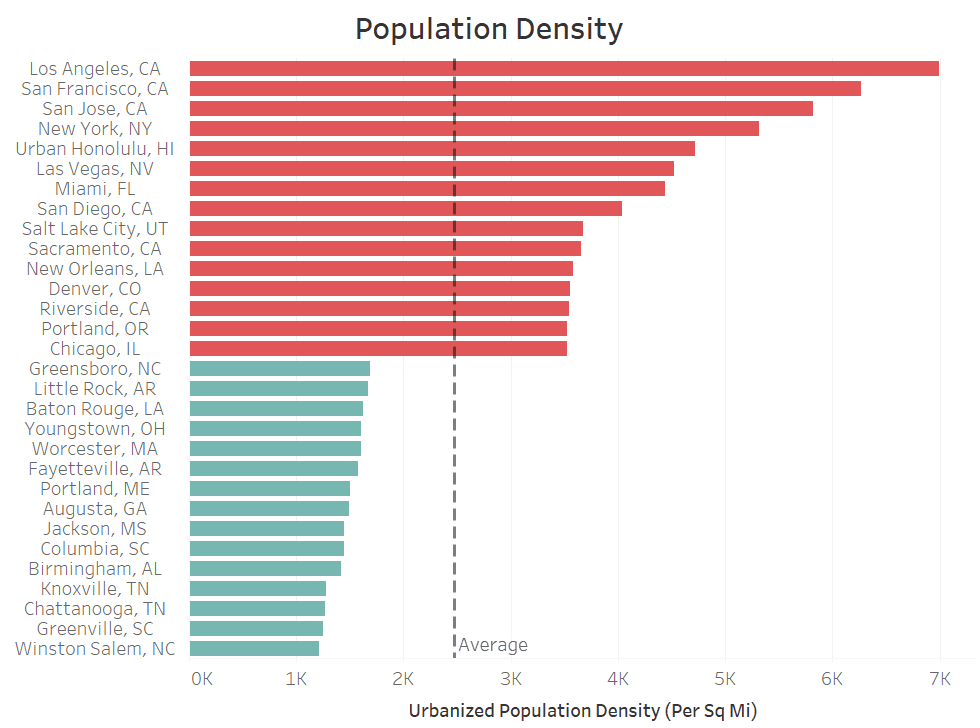
The first step in understanding how this reproduction rate can vary is by analyzing metros by their population density per square mile. In this case, we’ll use “urbanized” population density, which focuses on the built-up areas of cities (CBD and suburbs).
Los Angeles, the most densely populated metro in the US, registers nearly 7,000 people per square mile. This level is 2x denser than Chicago, the metro with the 15th highest density. And it is nearly 7x denser than Winston Salem, the metro with the lowest density.
As a result, the average resident in Los Angeles likely comes into close contact (walking on the street, riding the bus, going to the store, living in an apartment building, etc.) with significantly more people on a given day than someone living in Chicago or Winston Salem. This higher frequency of close contact increases virus transmissibility.
New York registers as the 4th densest metro at 5,300 people per square mile, 25% lower than Los Angeles. Despite this more muted population density figure, the New York area has succumbed to nearly 40k COVID deaths, roughly 10x higher than Los Angeles.
What accounts for this difference? Reliance on public transportation is likely a root cause.
The New York metro owns the unique distinction of being the only US region where a large share of workers commute via public transportation. Its 31% public transportation commute share is roughly double second-place San Francisco and more than 6x that of Los Angeles.
Public transportation, while it is efficient, environmentally friendly, and egalitarian, is a hotbed for COVID transmission. A single, 450 square foot subway car could house over 5,000 people in a day. Such an environment is rife for spreading airborne and surface-based germs.
Fortunately for the US, at least in terms of preventing future COVID spread, only six cities feature public transportation shares above 10%. These cities, with a heavy emphasis on New York and San Francisco, will likely be more prone to COVID outbreaks going forward.
Susceptibility
The susceptible population to COVID is very narrow and well-defined. 92% of COVID deaths have occurred in those 55 or older, while over 90% of COVID fatalities also had at least one comorbidity. Those who are old and sick are very susceptible to virus fatality while the young and healthy are not.
In a hypothetical society where everyone was below the age of 55 and in good health, COVID could spread to the entire population and there would be limited ramifications. Such a society doesn’t exist in the US. However, certain parts of the country are closer to that ideal than others.
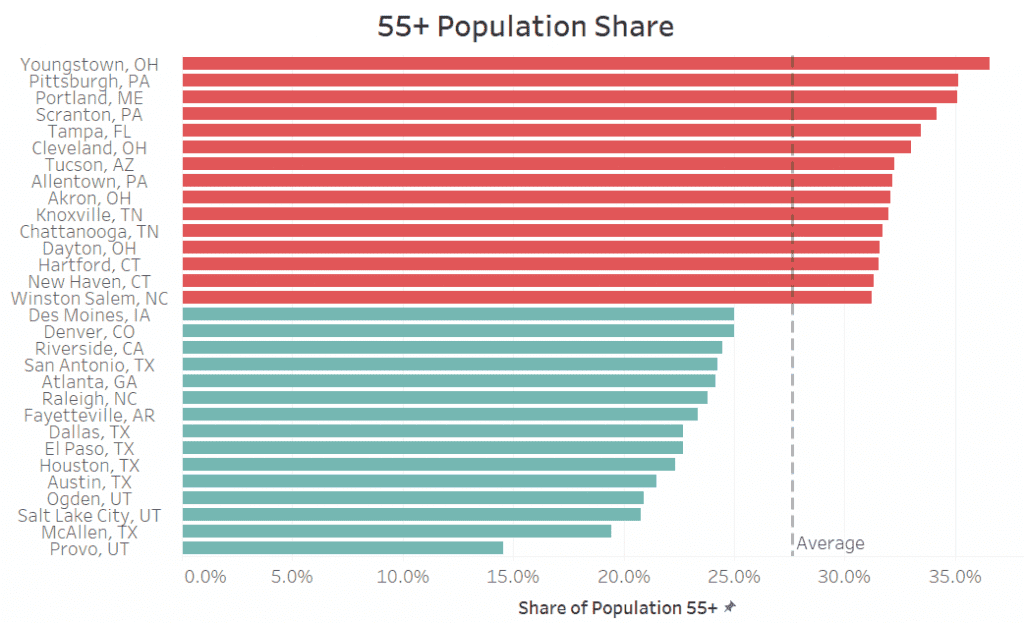
Over one-third of the metro population in Youngstown, Pittsburgh, Cleveland, and Akron are over the age of 55. Next to these Rust Belt towns are Sun Belt retirement areas like Tampa, Tuscon, and Knoxville.
At the other end of the spectrum are the youthful populations of Utah and Texas. Provo is the youngest large metro in the country, with only 15% of its population registering above 55 years old. Nearby Salt Lake City and Ogden come in around 20%. Texas’ big four – Dallas, Houston, Austin, and San Antonio – rank similarly.
Older areas will be more at risk of overwhelming healthcare systems if the virus spreads. They also will likely have a more hesitant consumer base, as older people will be more cautious about leaving their homes. These factors increase the odds of economic issues in metros with a higher share of the population above 55.
But age isn’t the only variable that determines susceptibility. Pre-existing conditions such as hypertension, diabetes, and heart disease assisted in 90% of COVID fatalities to date.
Earlier this year WalletHub conducted a study on the health of the largest 100 US Metros. They evaluated 19 different health-related variables, ranging from obesity to diabetes rates, and distilled them into a single “Health Score”.
McAllen, TX ranks as the most unhealthy metro in the US with an 84 score. Other unhealthy regions are universally located in the South and include metros like Memphis, Nashville, New Orleans, and Oklahoma City.
The healthiest cities, with scores in the 55 to 65 range, are a mix western growth markets like Denver and Portland with established urban hubs like Boston, and San Francisco.
Knoxville and Chattanooga have the unenviable honor of appearing on both the oldest and unhealthiest lists. Meanwhile, the Salt Lake region and Denver show up as young and healthy. The consequences of COVID spread in these metros are likely to be significantly different.
COVID Risk Index
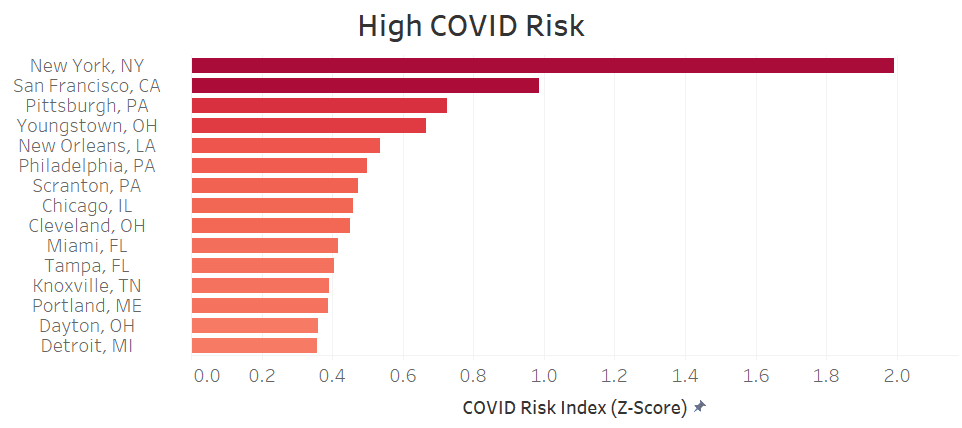
Combining the transmissibility and susceptibility variables results in an aggregate COVID Risk Index for each metro.
New York’s population density and reliance on public transportation result in aggregate COVID risk two standard deviations above the average metro. These risk factors were born out with the 40k COVID deaths, nearly 1/3 of the US total, that occurred in the region over the last four months.
San Francisco has yet to be significantly impacted by COVID but likely will be as it continues to open. As the only other city in the US to rank in the top five of both density and public transport use, it faces significant transmissibility issues.
Rust Belt cities such as Pittsburgh, Youngstown, Scranton, Cleveland, and Detroit each rank highly on the COVID Risk Index due to their older populations and medium population density.
New Orleans, one of the worst-hit metros by COVID thus far, has a very unhealthy population and above-average age and density.
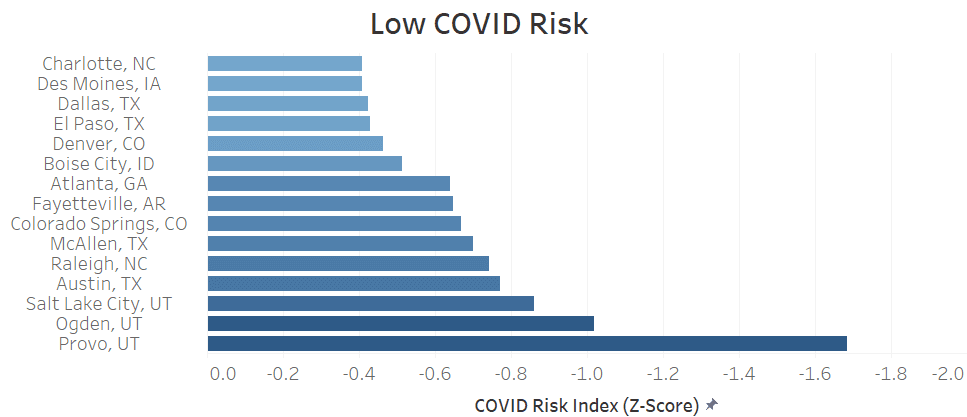
Utah is unanimously the least at-risk state, with Provo, Ogden, and Salt Lake ranking the lowest on the COVID Risk Index. The youthful and healthy populations of these areas combined with minimal public transportation use make it unlikely the virus will do significant damage. Brain hub markets like Austin, Raleigh, and Denver also maintain a lower risk profile for the same reasons.
Concluding Thoughts
Analyzing metro area transmissibility and susceptibility characteristics could help predict which regions will suffer the greatest health and economic impacts from COVID.
The variables discussed above are by no means an exhaustive list. Factors such as poverty rates and household size likely also play a role in COVID virulence. The prospect of herd immunity might also mean an area like New York faces less spread in the future.
Recent case spikes in Texas and Utah indicate that the least at-risk regions of the country are also exposed to COVID spread. However, as recurring waves of the virus take hold, the metros ranking lowest on the COVID Risk Index are likely to fare better in terms of managing spread, lowering hospitalizations, and keeping the economy open.
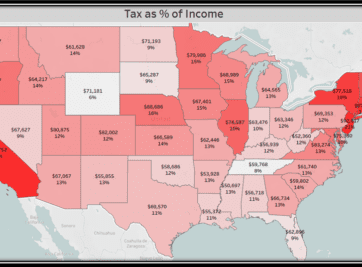
Was Tax Day more of a burden this year than years past? If you’re wondering whether there’s an escape from the inevitability of taxes let us give you the tools to analyze for yourself. Believe me, you’re not alone and not all states are created equal.
Home is where the heart is. Even in this volatile housing market you will always need a place to call home.
Has uncertainty and rising costs made home ownership unaffordable for many Americans? Let us provide some tools and analysis to help you find out for yourself.
The decision to buy or rent can be daunting and hopefully this methodology will help you in this monumental and stressful task. This article is meant to serve as a guide to assist in determining the true cost of home ownership for your situation.
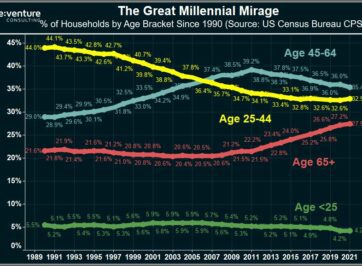
Millennials are supercharging the 2022 Housing Market, right? Wrong according to data from the US Census. In fact, Millennials are BOYCOTTING the Market.
Home Prices are up 20-30% across states like Florida and Texas in 2021. But there’s no growth in the number of people moving there. Is this a colossal bubble?
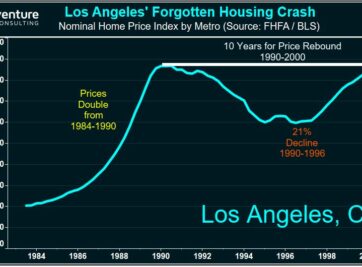
Florida’s Housing Market is BOOMING in 2021. But could the state be heading for another 50% crash in Home Prices? Certain data says that’s a possibility.
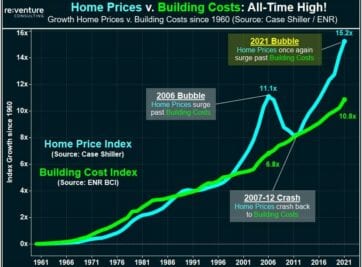
Surging Construction Costs in 2021 are being blamed for the Housing Market Mania being experienced in the US. Yet the data tells a very different story.