The decision to buy or rent can be daunting and hopefully this process will help you in this monumental and stressful task. This article is meant to serve as a guide to assist in determining the true cost of home ownership for your situation.
First, let’s look at the methodology that inspired my deep dive into the dilemma of whether to buy or rent. For a deep dive into the outcomes of this process in US metro areas click here.
The 5% Rule
Canadian portfolio manager Ben Felix coined “The 5% Rule,” which is a useful, albeit admittedly simplified tool, to calculate the unrecoverable costs associated with both renting and home ownership.
His formula calculates Unrecoverable Costs = property tax + maintenance costs + cost of capital
Without getting into the details, he estimates cost of capital at 3% with property tax and maintenance costs standardized at 1% each, giving you a nice, even 5%.
He then takes the rental cost, annualizes it by multiplying by 12, and then divides by the home value. If this percentage is less than 5%, it’s considered cheaper to rent, and vice versa, greater than 5% means it’s cheaper to buy.
The below graph shows the areas in red, which are better value to rent vs the areas in blue which are better to buy according to Ben’s formula. Lighter shades are closer to 5% or breakeven, with the darker shades representing stronger associations with buy or rent values.
Source: Zillow ZHVI and ZORI data for US median home and rental prices (Feb 2022)
While this is a helpful benchmark, it has its limitations. Namely, it does not account for variables including taxes, closing costs and fees, diversified investment returns, or a quantifiable measure of one’s value over the other.
Building upon the principles outlined in Ben Felix’s “5% Rule,” I developed a methodology that is standardized yet detailed enough to account for many of the nuances of home ownership.
The Sunk Cost Method
Let’s first define the variables and standards we are going to be using in our formula.
Property Tax – Due to the complexities and exemptions associated with local real estate laws, I used the state rate for calculations, I realize most metro areas will have higher property taxes than the state minimum, but this is a baseline.
Insurance: Take the state average for monthly premiums, then multiply by 12 for an annualized rate. * Interestingly, the central plains and Midwest regions have nearly double the annual homeowners insurance costs of the East and West coasts, likely due to the higher frequency of natural disasters.
Cost of Capital = Cost of Debt + Opportunity Cost
Cost of Debt: The amount of interest paid on the mortgage at the maturity period, less the tax shield (mortgage interest paid * tax bracket) assuming an interest of 3.9% (as of February 2022).
Opportunity Cost = Future Value (FV) of alternative investment premium – inflation – taxes – real estate appreciation * number of years (maturity) + Invested Closing Costs (3% of Home Value @ 5.5% annual growth)
To calculate opportunity cost we use a future value (FV) formula. We are trying to estimate the lost opportunity of investing in a home rather than in alternative markets such as equities. For this I use the S&P 500 index fund which has returned an average annualized rate of 10.5% since 1926. Next, we deduct inflation which has averaged 3.25% from 1914 – 2021 and a long-term capital gains tax of 15% (we are assuming this is not in a tax deferred account). Last, we will deduct the average annual real estate increase of 3.5%.
What we are left with is 2.25%, representing the equity value added from using alternate investments. We then multiply this by 20% of the home price (estimated down payment) and determine the future value of that down payment had it been invested by other means.
** Note: These are long term averages and the post pandemic world has seen significant volatility in the housing market, but these effects are also felt in inflation and the S&P 500 thus we will use historical averages.
*** Note: For closing costs I used a 5.5% annual return because we are not measuring this against the alternative of home appreciation as you are not getting any home equity from closing costs.
We take that number and determine the maturity, be it 3, 5, or 10 years.
Then to determine the unrecoverable cost of renting, multiply the annualized rental costs and compound at 5% annually for the same maturity period.
By dividing 1 – (Buying sunk costs / Renting sunk costs) we figure out the percent difference between buying and renting. A positive percentage means it is better to buy while a negative means it is better to rent.
Source: Zillow ZHVI and ZORI data for US median home and rental prices (Feb 2022)
Regionally speaking, there are not many differences in the distribution of buy versus rent metro areas when using the 5% rule vs Sunk Cost Method. However, the explanatory value allows you to quantify the difference and determine the best investment for your unique situation.
Let’s Do an Example
We will use the median home price in NYC at $577,647 at 3.9% interest vs. the median rent of $2,804 for a period (maturity) of 5 years.
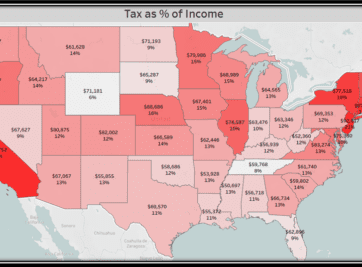
Was Tax Day more of a burden this year than years past? If you’re wondering whether there’s an escape from the inevitability of taxes let us give you the tools to analyze for yourself. Believe me, you’re not alone and not all states are created equal.
Home is where the heart is. Even in this volatile housing market you will always need a place to call home.
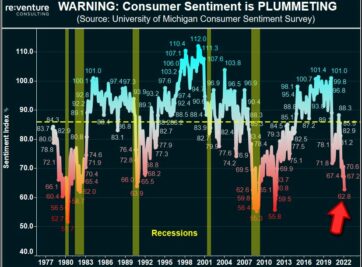
Has uncertainty and rising costs made home ownership unaffordable for many Americans? Let us provide some tools and analysis to help you find out for yourself.
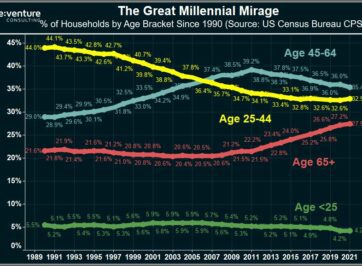
Millennials are supercharging the 2022 Housing Market, right? Wrong according to data from the US Census. In fact, Millennials are BOYCOTTING the Market.
Home Prices are up 20-30% across states like Florida and Texas in 2021. But there’s no growth in the number of people moving there. Is this a colossal bubble?
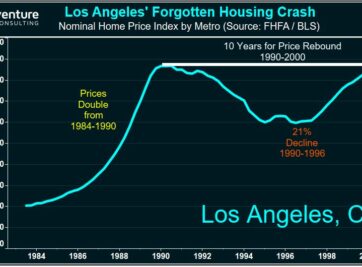
Florida’s Housing Market is BOOMING in 2021. But could the state be heading for another 50% crash in Home Prices? Certain data says that’s a possibility.
Surging Construction Costs in 2021 are being blamed for the Housing Market Mania being experienced in the US. Yet the data tells a very different story.
Where are the real estate markets that offer home buyers and investors the most value during the 2021 Housing Bubble? Reventure Consulting teaches you how to use data to find them!