“How bad will this Housing Crash be?”
Will home prices in my city decline? And if so, by how much? When will it be safe to buy?
I receive these questions everyday from would-be home buyers and real estate investors. They are rightfully nervous about buying into the 2021 Housing Market – arguably the most overvalued in US History. Many are feeling pressure from realtors, the financial press, and their friends to “BUY NOW before it’s too late!”
With all of this pressure – how do you make the right decision?
Let history be the guide. Understand what’s happened before. How bad were previous Housing Crashes? Which Cities got hit? Why did they get hit?
In this post I will reveal to you the 5 WORST HOUSING CRASHES of all-time. Understanding what happened during these crashes, where it happened, and the commonalities they shared, can provide key insights into the 2021 Housing Market. Specifically surrounding which cities to avoid and when it will be safe to buy.
Before we dive into the list, it’s important to understand that there’s two ways that a housing crash can be bad. The 1st, and most obvious way, is through big declines in home prices. The bigger the decline, the worse the crash. But the 2nd, less obvious way, is through duration. Some crashes last a very, very long time, meaning that it can take years and even decades for real estate values to return to previous highs.
This list will balance both price declines and durations in an attempt to discover the worst Housing Crashes of all-time. The data to support this analysis comes from the FHFA Home Price Index, which tracks home price data on US Housing Markets back to the mid-1970s.
Note: this list will exclude any Housing Crash that occurred during the US Housing Bust that occurred from 2007-12. While the worst crashes in US History occurred during this period, many of them are fairly well known and understood. For this post I wanted to dig back further, into the 1980s/90s, to cover some lesser known regional Housing Crashes.
5. Hartford, CT
Period: 1988 to 2001
Duration: 13 Years
Peak Price Decline: -21%
Hartford, and much of Connecticut, is known as an economically destitute place in 2021. But this was not the case 35 years go. Back in the 1980s Hartford, and much of greater New England, was a bustling economic center, propelled forward by growing insurance, manufacturing, and government defense industries. The local Housing Market boomed as a result, with home prices doubling in value from 1984-88.
But in the late 1980s Hartford’s principal industries all declined at the same time, resulting in massive job losses across the metro. The institutional economic decline had a contagion effect, resulting in many small businesses shuttering their doors. The net result was a massive exodus from the city, with Hartford’s population declining by a massive -11% from 1990-94.
The impact on the local housing market was devastating. Home prices, after doubling in value from 1984-88, suddenly went into reverse. At first the reverse was moderate, with prices only going down slightly in 1989. But the bottom dropped out when the 1990s hit, with prices tanking by over 20% through 1997.
But what was especially devastating about this crash was the duration. Not only did it take nearly 9 years for prices to bottom. It took another 4 years for prices to rebound. That means that 1988 Hartford home buyers needed to wait 13 years, until 2001, for values to get back to their purchase price!
4. Austin, TX
Period: 1986 to 1994
Duration: 8 Years
Peak Price Decline: -26%
Austin, TX managed to largely avoid the last National Housing Crash, which occurred from 2007-12 (values only dipped by about 5%). This relatively strong historical performance has many Austin real estate investors convinced that their local market is immune to cyclical downturns in the Housing Market.
However, going back further into history, we can see that Austin actually experienced one of the worst Housing Crashes in US History in the late 80s/early 90s. Home prices peaked in 1986 before collapsing by a spectacular 25% through 1991.
Back in the 1980s Austin’s economy, and Texas’ as a whole, was more closely tied to the oil industry. And the massive decline in the price of oil that occurred in the mid-1980s left the local economy reeling. Job losses were abundant. Business magnates and government officials declared bankruptcy. Austin’s office vacancy rate skyrocketed to 40% by 1987.
All of this occurred in a city that loved to build new homes, resulting in a massive oversupply of housing inventory. One Austin realtor had a glut of 6,100 homes for sale. It was bad. Those who bought a home in Austin in 1986 patiently waited until 1994 to re-claim the value of their original purchase price.
The good news for Austin today is that it is no longer reliant on oil to power the local economy. However, it is now heavily exposed to a different sector: tech.
3. Los Angeles, CA
Period: 1990 to 2000
Duration: 10 Years
Peak Price Decline: -21%
The mid to late 1980s were a party across Southern California. The weather was nice. Jobs were plentiful. Wages were going up. Home values across Los Angeles doubled from 1984 to 1990.
But the music stopped – abruptly – in the early 1990s. Cuts to US Defense and Military spending after the end of the Cold War had a devastating impact on the local Los Angeles economy. Job losses reached a peak of -6% in 1992, one of the worst impacted areas of the country and state (by contrast, San Francisco only experienced -2.5% losses).
The result was pandemonium in Los Angeles’ housing market. The Housing Bubble turned into a Housing Crash. Home owners who were laid off rushed to sell. Others were foreclosed on. Many people left the metro entirely for greener economic pastures in Arizona and Nevada. Home prices started their decline in 1990 and collapsed by over 20% before bottoming out in 1996.
It then took another four years for prices to recover to their previous highs. Meaning that those who bought a home in Los Angeles in 1990 had to wait 10 YEARS – until 2000 – to recover their acquisition value. Note that similar home price declines also occurred in Orange County and Riverside.
Los Angeles also got hit very hard in the 2007-12 Housing Crash, with values declining by 37% during that period. This means that in 10 of the last 30 years the Los Angeles metro has experienced home price declines. Make sure to bring that up to your local LA realtor the next time they pressure you into buying at record-high prices in 2021.
2. Houston, TX
Period: 1983 to 1998
Duration: 15 Years
Peak Price Decline: -25%
“Houston, we have a problem”!
Said every realtor, home owner, and real estate investor in Houston across much of the 1980s and 1990s. The economic recession, and resulting housing crash, that hit Houston during this period is arguably the worst in American history.
Before the crash times were good. From 1976 to 1983 home prices across Houston increased by a robust +83%. This was largely due to a local economic boom tied to the sky-high oil prices of the time. While most of America hated the higher prices, and rationing that went along with it, Houston – the epicenter for the US Oil Industry – loved it. Anecdotes from the time claim that rich oil executives, flush with cash, would take their helicopters to work from the suburbs to avoid the traffic on I-10.
But good times don’t last forever. And when oil prices began declining in the early 1980s the bottom fell out of the economy and housing market. Houston lost over 200,000 jobs from 1982 to 1987. Home prices during that period dropped by a massive 25%. Things got very, very ugly.
But what makes this Houston Housing Crash particularly bad was the duration. Not only did prices drop by 25% from 1983-1988. They then took another decade to recover. That’s right folks. A home buyer in Houston in 1983 would have had to wait 15 years to recover their original value. Unbelievable.
Two Texas markets on this list – Austin and Houston – is no accident. The sky-high rates of home building in Texas, combined with large increases in home prices, can cause big problems. Something to think about in 2021 when we’re seeing a similar prelude play out.
1. Anchorage, AK
Period: 1984 to 1998
Duration: 14 Years
Peak Price Decline: -39%
Bank failures. Job losses. Empty homes. This was the scenario in Anchorage over a nearly 15-year period from 1984 to 1998.
Similar to Houston, Anchorage’s economy was heavily dependent on oil. This led to boom years in the late 1970s/early 1980s. But as soon as oil prices began dropping, Anchorage’s economy and housing market began to unwind. More than 20,000 jobs left the state from 1985-87. 40% of local banks failed.
As one resident explained: in 1971 “you could smell the money”. By 1986 “everybody was doing what it took to survive”.
The result was the worst nominal home price crash in US History (excluding the 2007-12 period). Home prices in Anchorage began falling in 1984 and kept falling all the way to 1990, erasing values by 39%. That’s nearly double the decline that occurred in markets like Hartford and Los Angeles, discussed earlier on this list.
In addition to the steep price declines, the crash lasted a long, long-time. Someone who bought a home in Anchorage in 1984 waited until 1998 for their value to return to the previous peak.
What did we Learn (2021 Housing Bubble)?
So – what can we learn from the unfortunate experiences in these cities? And how can we apply it to make better decisions during the 2021 Housing Bubble?
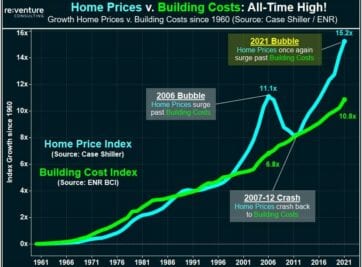
The 1st Commonality these markets shared was a big run-up in home prices prior to the crash. This is an important thing to remember. In order to have a Housing Crash, you need to first have a Housing Bubble, where prices escalate at historically high rates.
These value increases are often aided by the 2nd Commonality. Big economic expansion during the Bubble. Increases in jobs, GDP, and wages are typical during the run-up in prices that precedes the Housing Crash. This is an important thing to remember, because many home buyers/investor make the mistake of thinking robust economic growth and migration means a market can’t crash. In fact, it’s just the opposite.
The 3rd Commonality is an economic trigger. In Hartford it was the decline in insurance and manufacturing. In Los Angeles it was defense. In Austin, Houston, and Anchorage it was oil. There typically needs to be a regional economic downturn for home prices to experience a big decline. And the bigger the downturn, the longer the decline.
Many parts of America are already in a big economic decline, with metros such as Los Angeles, New York, and Las Vegas still down 7-8% on their job counts from pre-pandemic levels. Be careful in these Housing Markets.
Economic concentration appears to also be a 4th Commonality. Many of the 5 Crash Markets were heavily reliant on one industry to propel growth and sustain home prices. When that industry declined, there was nothing to backstop the Crash.
Be wary of buying into markets today that are relying too much on a specific sector of the economy – for instance, tech – to support home price growth. Most major metros in California, as well as tangential tech hubs across Austin, Salt Lake City, and Denver have heavy exposure to a single industry while sporting sky-high prices. This could be a big problem.