As the adage goes, “home is where the heart is.” Even in a volatile US housing market, one constant remains—people will always need a place to call home.
Yet, the pursuit of home ownership has shifted throughout the years. Since the late 2000s crash, renting has become more prevalent than ever, and private real estate investment has increased significantly. Furthermore, a survey by Bankrate in May of 2021 found that 64% of millennials say they have regrets about purchasing their home.
This begs the question: Has owning a home become too much of a burden for the average person to bear? Or could renting result in a net gain for someone’s portfolio, rather than an assumed loss?
Historical consensus suggests that it’s better to buy than rent if you plan to live in your house more than 5 years. But if you’re an investor, or a home buyer looking for value, you need more than rhetoric to support that conclusion – you need a detailed, data-backed evaluation method.
After searching for tools that didn’t offer a complete picture, I developed one to help guide you through the process. Given this new method, your answer to the rent-versus-buy dilemma may surprise you.
Let’s jump in.
Challenging Assumptions
Our first step is to look at the trends in rental and home values to see if the increases have been proportional.
Source: Zillow ZHVI and ZORI data for US median home and rental prices (Feb 2022)
Since 2014, we see a steady trend in both housing and rental price appreciation with rental prices observing cyclical increases during the spring and subsequent declines during the fall while home appreciation remains fairly consistent.
Then, in July of 2020, home prices began to surge. Rental prices followed suit six months later, at an even faster rate with both peaking around 2% month over month appreciation in July of 2021.
What happens next is where it gets interesting. Since July, rental appreciation has been sharply decreasing with current prices nearly flatlined. In contrast, home prices are still rising above 1.4% month over month.
Does this mean that the rental market has been less affected by inflationary pressures—and thus, is a better value? Or is real estate a steady hedge against inflation
The trend looks that way… but what does the data say.
While the work-from-home revolution has encouraged plenty of people to re-locate, not everyone has the ability or opportunity to do so and avoid potential markets in a bubble. Therefore, we will focus on the choice to rent or buy.
Going a Step Further: The Sunk Cost Method
Trends certainly seem to be pointing to more favorable conditions for renting but we are looking at this from a longer-term perspective. We need to compare all the costs associated with buying and renting to give a fair comparison with the ultimate goal being to determine net equity.
Building upon the principles outlined in Ben Felix’s “5% Rule,” I developed a methodology that is standardized yet detailed enough to account for many of the nuances of home ownership.
The idea is that we will compile all the costs associated with buying – less the equity you are building in your home by owning – and compare it to rental payments, plus alternate investments (opportunity costs), to see which is better long term.
Here is the breakdown of homeowner costs I will refer to as sunk costs for clarity:
Opportunity Cost = ((Value of alternative investment – inflation – taxes – real estate appreciation) * number of years (maturity)) + invested closing costs (3% of Home Value @ 5.5% annual growth)
We take the total, determine the maturity, be it 3, 5, or 10 years, then compound it.
For a detailed breakdown of the methodology click HERE.
Sunk Costs (Renting): This one is quite simple: Multiply the annualized rental costs compounded at 5% annually (for inflation), for the years of maturity, in this case 5.
Analysis: By dividing 1 – (Buying sunk costs / Renting sunk costs) we determine the percent difference between buying and renting.
***A positive percentage (blue) means it is better to buy while a negative (red) means it is better to rent. Lighter shades are closer to 0% or breakeven, with the darker shades representing stronger associations with buy or rent percentages.
Source: Zillow ZHVI and ZORI data for US median home and rental prices (Feb 2022)
One Size Doesn’t Fit All
As you can see, there are strong regional differences in the distribution of buy versus rent metro areas when using the Sunk Cost Method. Additionally, if we want to modify our yields this formula allows us to tailor the expected returns of an investment to better evaluate alternative strategies over a given maturity period.
So how do we determine the breakeven monthly price?
Simply take the cumulative sunk costs, divide by 12, and then divide again by the maturity period (i.e. 5 years). This gives us a target monthly rental price to benchmark. If our potential rental is below this number, it would indicate better value to rent and vice versa, above the price would be better to buy.
Revealed: Best and Worst Markets to Buy In
When analyzing the top 100 metropolitan statistical areas in the US, 40 are cheaper to rent than buy over a 5-year period. Looking below we see that many of the worst markets to buy are in the West and Southwest. With renting in San Francisco (89%), Austin (60%), Seattle (50%), Salt Lake City (39%), L.A. (33%), Portland (33%), and Denver (31%) considerably cheaper than buying. Moreover, we see some surprises on the list with places like Madison (29%), Omaha (25%), and San Antonio (20%) also favoring rent.
Source: Zillow ZHVI and ZORI data for US median home and rental prices (Feb 2022)
Conversely, analyzing the best market ratios to buy in over a 5-year period, we find some interesting statistics. (Below)
The Southeast and Midwest provide much better value for home buyers with cities like Winston-Salem (35%), Miami (30%), Tampa (23%), Pittsburg (22%), Indianapolis (18%), Orlando (19%), and Atlanta (16%) significantly cheaper to buy vs rent over a 5-year period.
Source: Zillow ZHVI and ZORI data for US median home and rental prices (Feb 2022)
What’s Going on With Florida??
But hasn’t Florida had an enormous influx of people and subsequently seen astronomical increases in property values? Why are there so many Florida cities on the list? The data shows that despite these increases, the dramatic increases in rent have still made buying more favorable than renting.
Just to caveat, this does not mean homes are not overvalued in these areas, just that the median rental prices make buying a relatively better value over renting.
What does all this mean?
Well, that is up for you to decide. If your investment portfolio can substantially outperform the market, that may drastically tip the scales in favor of renting. However, if you fear a market pullback and diminished returns, you may prefer the comfort of typical home appreciation.
As an example, an increase of 3% in the expected market return over a 5-year period, swings the sunk cost pendulum 15% toward renting in the DC metro area.
Another consideration is the psychology of homeowners. Are people waiting for prices to stabilize before putting their homes on the market? If you thought your home might appreciate an additional 25% next year, why would you sell now? But if you did, you would still need to find a replacement, which is likely susceptible to the same market volatility.
There will never be a perfect evaluation method as this is a truly personal decision. As such, there are several variables I left out that are hard to quantify, such as HOA’s, governmental assistance, veteran’s benefits, and tax incentives.
For some, you simply can’t put a price on the sense of freedom you get from owning your own home. For others, the anxiety of having to deal with a myriad of potential problems is enough to deter them.
Ultimately, your ability to make a sound decision will depend on data-driven research, and the mental discipline to exercise patience, not act out of desperation. Regardless of whether you feel like you missed opportunities in the past, it’s important to think long-term because there are always more that lie ahead. Happy hunting!
References
Bankrate estimates for homeowners and renters’ insurance from quadrant information services (2021)
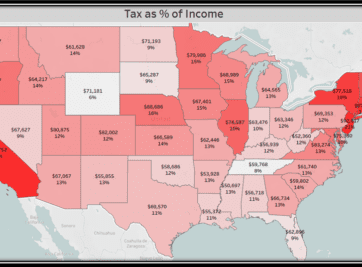
Was Tax Day more of a burden this year than years past? If you’re wondering whether there’s an escape from the inevitability of taxes let us give you the tools to analyze for yourself. Believe me, you’re not alone and not all states are created equal.
The decision to buy or rent can be daunting and hopefully this methodology will help you in this monumental and stressful task. This article is meant to serve as a guide to assist in determining the true cost of home ownership for your situation.
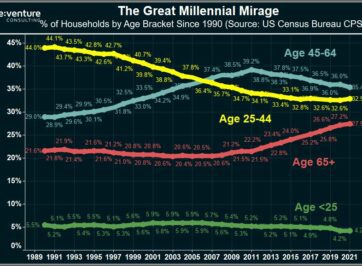
Millennials are supercharging the 2022 Housing Market, right? Wrong according to data from the US Census. In fact, Millennials are BOYCOTTING the Market.
Home Prices are up 20-30% across states like Florida and Texas in 2021. But there’s no growth in the number of people moving there. Is this a colossal bubble?
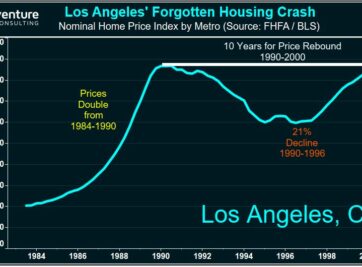
Florida’s Housing Market is BOOMING in 2021. But could the state be heading for another 50% crash in Home Prices? Certain data says that’s a possibility.
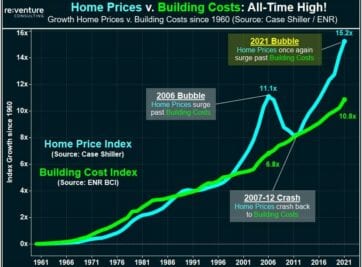
Surging Construction Costs in 2021 are being blamed for the Housing Market Mania being experienced in the US. Yet the data tells a very different story.
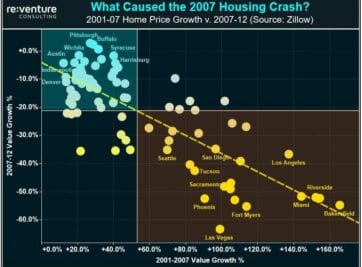
Where are the real estate markets that offer home buyers and investors the most value during the 2021 Housing Bubble? Reventure Consulting teaches you how to use data to find them!