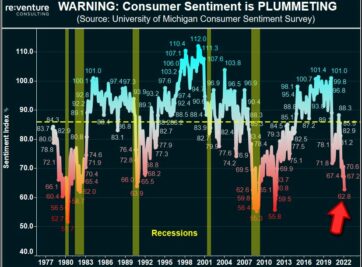
90% Chance: RECESSION in 2022?
Oil Prices are Surging. Consumer Sentiment is Crashing. The odds of a 2022 Recession have SKYROCKETED in recent months.
Real estate values today are nearly 70% higher than their levels in 2012. And even in the midst of a new recession and widespread COVID fears, they just keep growing. The question on everyone’s mind right now is: Are we in a real estate Bubble?
The answer depends on what area of the country you’re talking about. Some markets definitely appear to be in a Bubble. Others look secure.
Let’s start with the fundamentals. The two most important drivers of real estate values are 1) income growth and 2) population growth. You don’t need an economics Ph.D. to know that these variables matter. But let’s dig into them anyway.
Higher incomes give households more money to spend on rent and mortgage payments. Higher incomes also enable banks to lend more money on home purchases. The combination of these effects makes income growth a very strong predictor of value growth, evidenced by the graph below.

From 2009 to 2019, growth in median household income explained over 40% of the variation in home value growth across large US metros. That’s a very strong relationship. But clearly, there’s more to it than that.
My preference, and I suspect most other people’s preference, is to spend less on housing, not more. So ultimately I need to be forced to spend my income growth on housing costs. What would force me to do that?
Population growth. If the nearby population is increasing at a fast rate, it’s unlikely the existing supply of housing will be able to keep up. That will increase the net demand for homes and put upward pressure on values.

Sure enough, population growth explains over 30% of the variation in home value growth from 2009 to 2019 across large US metros.
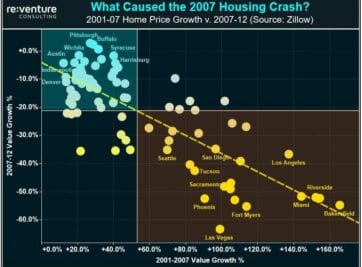
Now let’s combine these concepts. If a market achieves a strong combination of population and income growth, then it should be expected to experience a corresponding increase in real estate values. But what if a market is experiencing value growth above what’s predicted by its population and income growth?
Then it’s likely in a Bubble, evidenced by the blue dots in the below graph.

These blue dot markets – the likes of Las Vegas, Dallas, Denver, and Detroit – have experienced home value growth above and beyond what was predicted by the underlying fundamentals of population and income growth.
Meanwhile, the green dots – Seattle, Raleigh, Jacksonville, and Washington DC – represent markets where home values have gone up less than expected given their fundamentals.
To further illustrate this point, let’s compare Denver, a blue dot, to Raleigh, a green dot. Both markets had nearly identical population and income growth rates. Yet home values in Denver went up 2x more than Raleigh (76% v. 40%).
Homebuyers and investors getting into the Denver right now are likely overpaying relative to the fundamentals of the market. In comparison, a market like Raleigh looks like a bargain.
This analysis isn’t full proof. There are considerations such as supply constraints and future income and population growth expectations that could also influence real estate value growth. And perhaps a place like Denver was undervalued back in 2009, making its outperformance since then merely a catch-up to its true value.
Even so, the blue dot markets have the looks of an expanding Bubble. Buyer beware if you’re entering them right now.
E-mail Reventure Consulting to learn more about how the data presented in this article can help your real estate company make smarter investment decisions.
Oil Prices are Surging. Consumer Sentiment is Crashing. The odds of a 2022 Recession have SKYROCKETED in recent months.
Millennials are supercharging the 2022 Housing Market, right? Wrong according to data from the US Census. In fact, Millennials are BOYCOTTING the Market.
Home Prices are up 20-30% across states like Florida and Texas in 2021. But there’s no growth in the number of people moving there. Is this a colossal bubble?
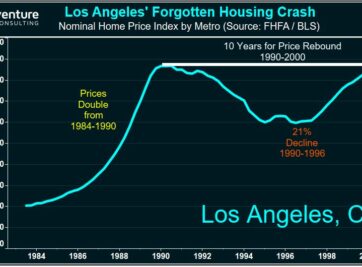
How bad will the 2021 Housing Crash be? Find out by looking back in history at the WORST Housing Crashes of all-time.
Florida’s Housing Market is BOOMING in 2021. But could the state be heading for another 50% crash in Home Prices? Certain data says that’s a possibility.
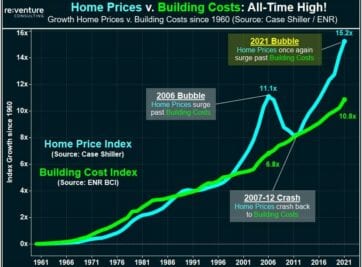
Surging Construction Costs in 2021 are being blamed for the Housing Market Mania being experienced in the US. Yet the data tells a very different story.
Where are the real estate markets that offer home buyers and investors the most value during the 2021 Housing Bubble? Reventure Consulting teaches you how to use data to find them!
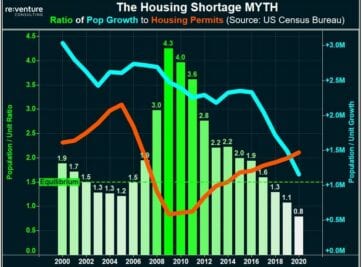
Many pundits try to argue that the US is facing a housing shortage crisis. These people are wrong. In fact, the demographic data says the exact opposite – that there is a shortage in DEMAND for homes.
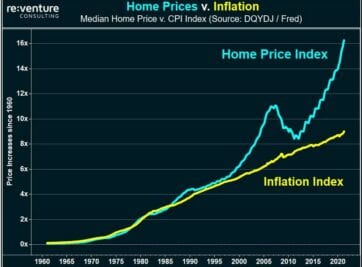
Prices in the US Housing Market are at record levels in 2021 relative to wages and inflation. Yet we’re in a deep economic recession. How could this be? Well, blame HGTV.
Sign up to hear insights from Reventure