Home buyers, real estate investors, and developers love Gentrification – a process characterized by the influx of investment, businesses, and wealthy residents into a neighborhood. Why do real estate owners love this process so much? Gentrification increases real estate values!
But measuring Gentrification can be difficult. After all, every realtor and local owner will tell you that their neighborhood is experiencing tons of it and that you should buy there. So how does a home buyer or real estate investor cut through the BS and target the areas experiencing true gentrification?
By using data!
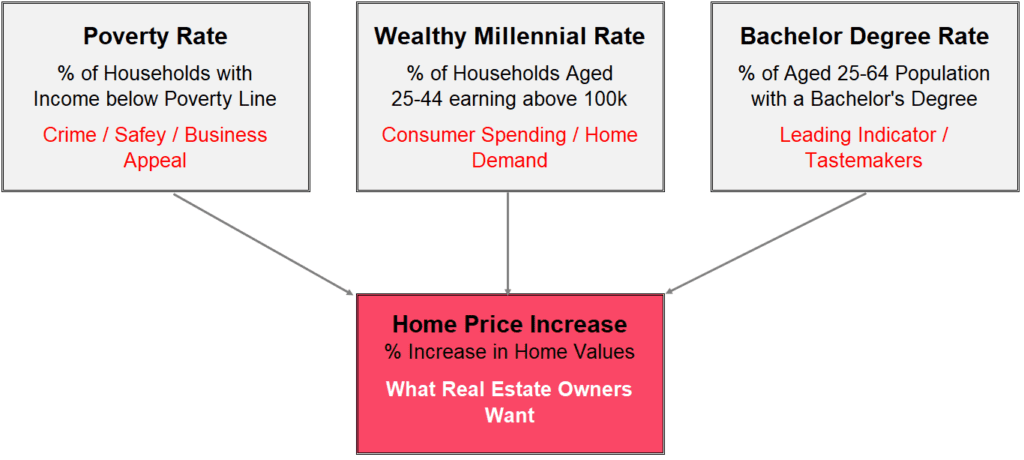
This article will use US Census data by ZIP Code to highlight the 8 neighborhoods across the country currently experiencing the most gentrification. The neighborhood’s Gentrification Score will be determined by analyzing the key factors that impact gentrification, defined below:
A decrease in Poverty Rate is important for improvements in neighborhood safety as well as the overall desirability of the neighborhood for new businesses. Increases in Wealthy Millennials drive local consumer spending and, most importantly, significantly increase the demand for homes, since they are the main home-buying demographic. Residents with Bachelor Degrees are important because they are the educated, creative class that tends to make areas “cool” early on and drive local tastes.
But these increases in Gentrification need to be weighed against the increases in Home Prices in the neighborhood. Some areas have seen home price growth far above what the Gentrification indicators would suggest. Buyers and investors might want to avoid these fully-priced neighborhoods since future appreciation will probably slow. Meanwhile, other neighborhoods still remain affordable in the midst of Gentrification, providing plenty of room for values to grow into the future. These are the neighborhoods home buyers and investors will want to target!
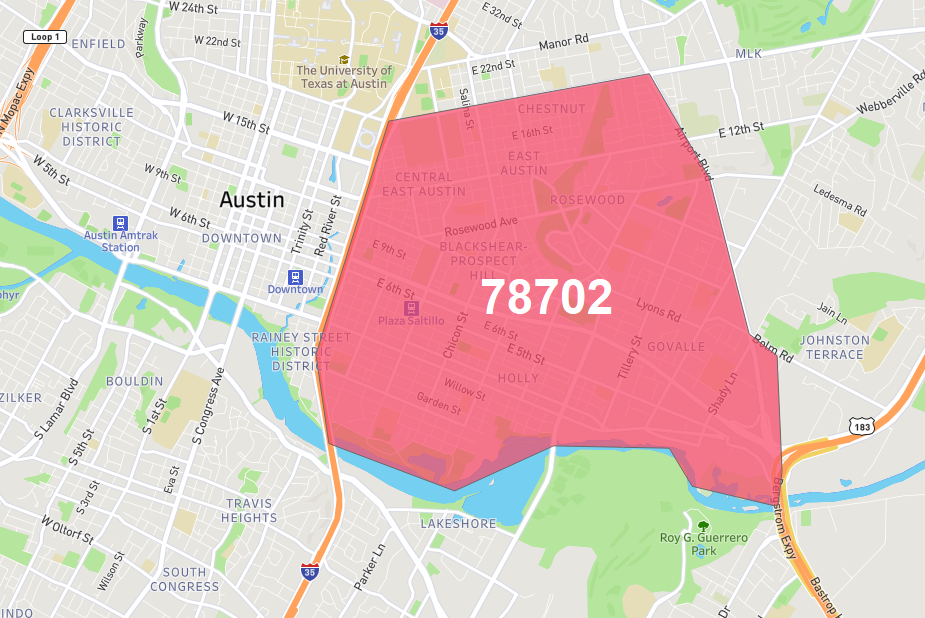
Austin (78702 – East Austin)
78702 (East Austin) has experienced the highest home price growth of any neighborhood in this list.
Look up the definition of Gentrification in the Oxford Dictionary and you will likely see a reference to 78702 (East Austin). This neighborhood is the template for gentrification in the 21st century.
The neighborhood’s Poverty Rate, which was at a very elevated 31% in 2011, was cut down to 20% by 2019. In the process the number of Wealthy Millennials living nearby more than tripled, increasing from 8% of households to 26% of households in the same span.
78702 is benefiting from two principal things. The first is Austin’s tremendous overall growth, with the metro adding jobs and corporate relocations at a feverish pace. The second is East Austin’s proximity to Downtown Austin. It’s situated in the natural path of growth, with the wealth density of Downtown Austin spilling over.
These realities have not been lost on home buyers and real estate investors. The typical home price in 78702 has gone up by an absurd +149% over the last decade, increasing from $211k to $527k. This rate of appreciation far outstrips income growth in the neighborhood, indicating that East Austin’s future growth will slow.
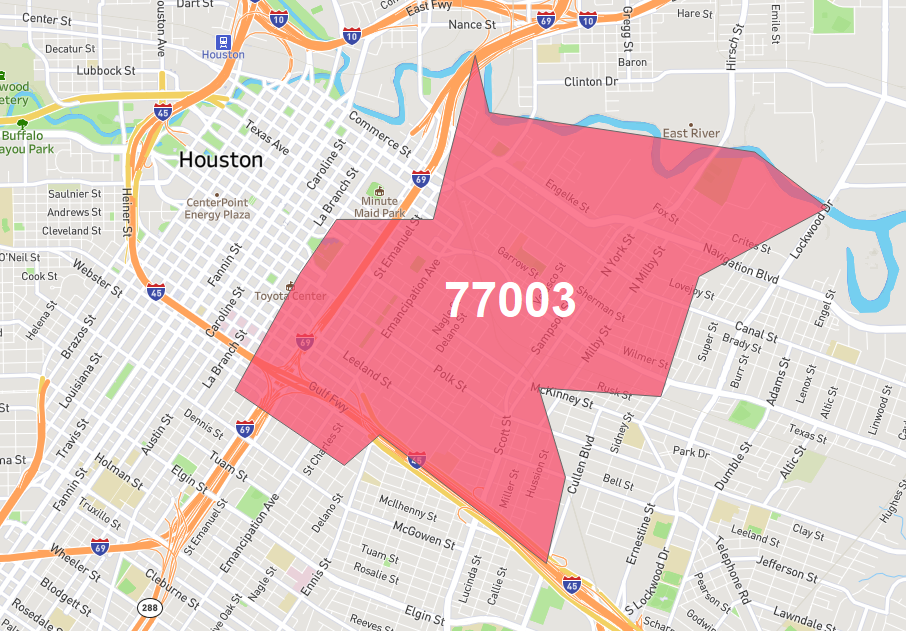
77003 (East Downtown) is one of the fastest-growing ZIPs in Houston.
Houston is kind of like the Wild West. The city’s heavy ties to the oil industry means local real estate goes through cyclical booms and busts. Houston’s lax zoning laws also mean it’s easy for developers to build, creating positive gentrification in some neighborhoods but housing gluts in others.
Fortunately, 77003, known as East Downtown or EaDo, is one of the safer places to buy real estate in Houston. The neighborhood has benefited immensely from the construction of BBVA Compass Stadium in 2012, the home of the Houston Dynamo, Houston’s MLS soccer team. The result has been a significant expansion in food and beverage offerings as well as apartment housing development.
This growth has caused the Wealthy Millennial Rate to triple from 9% in 2011 to 27% in 2019. The neighborhood’s Bachelor Degree Rate has also doubled from 26% to 50% in the same span. East Downtown’s rates of Wealthy Millennials and Bachelor Degree’s are comparable to East Austin.
Yet home prices are significantly cheaper. According to data from Zillow, the typical home in the neighborhood is worth $312k as of January 2021. This provides home owners and investors with plenty of runway for future appreciation.
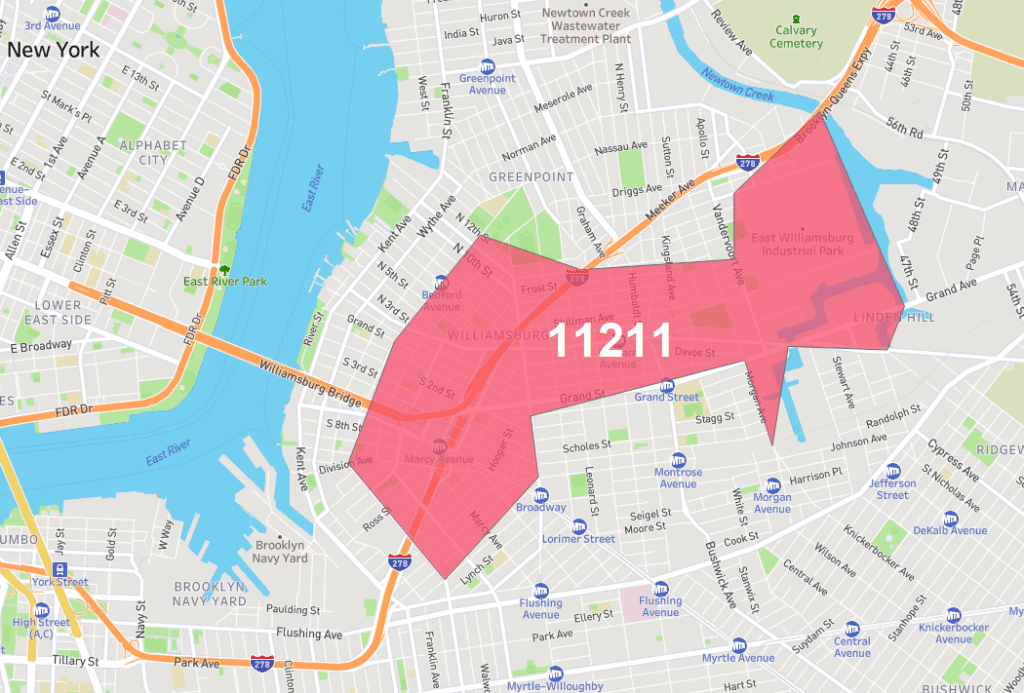
11211 (Williamsburg) is a Gentrification haven. But it’s typical home price of $1.0+ million prices out most home buyers.
11211, the ZIP code encompassing Williamsburg in Brooklyn, is a poster child for the positives and negatives of Gentrification. On one hand, an area that was extremely high poverty and destitute in the 2000s has turned into a thriving community.
But on the other hand, the typical home in the ZIP code, which is normally a smaller condo, now costs over $1.0 million. This price point puts home ownership out of reach for the vast majority of the neighborhood’s residents, which is bad in two respects: 1) it decreases social equity and growth and 2) it will likely result in a home price decline in the future.
While Williamsburg’s Wealthy Millennial Rate of 32% is the highest in this set of ZIP codes, the disconnect between the neighborhood’s $81k median household income and $1.0 million typical home price is the largest. The heavy price declines experienced in Manhattan’s real estate market over the last year will likely draw some of Williamsburg’s higher earners back to main island, putting downward pressure on Williamsburg home prices.
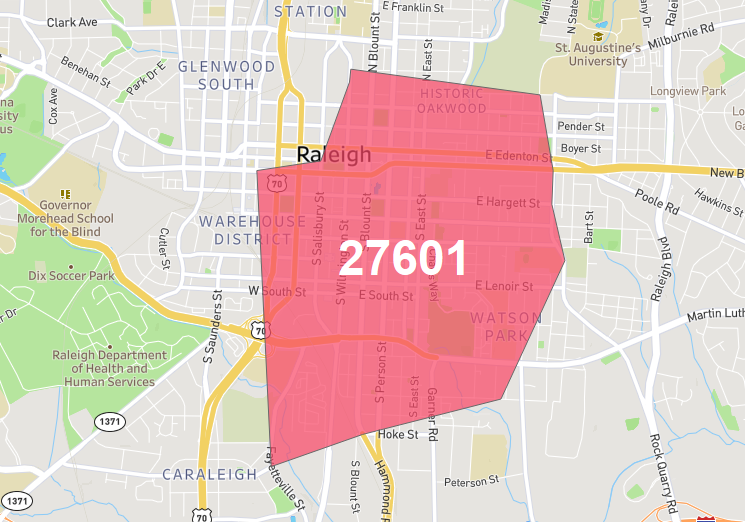
27601 comprises several different neighborhoods – Fayetteville, South Park, and Patterson Green.
Are you starting to notice a trend here? Neighborhoods to the Eastern Section of a city’s Downtown have done very well over the last 10 years. Raleigh is no different, with 27601 – a ZIP code comprising the eastern portion of Downtown along with South Park and Patterson Green – has experienced huge Gentrification.
The Poverty Rate in 27601 was an astronomical 47% back in 2011, meaning that nearly half the households earned below the poverty line (roughly $20k per year). That rate was cut back all the way to 27% in 2019, still elevated but showing massive improvement.
At the same time, the Wealthy Millennial Rate has increased by 5x from 4% to 20%. Most impressively, Median Household income has grown by an astounding +158% during that span, increasing from $20k to $51k.
Home prices have also grown – by 85% over the last decade – from $203k to $377k. The fact that incomes have grown much faster than home prices is a positive, and means that their should be more meat on the bone for values to appreciate into the future.
Philadelphia (19146 – Greys Ferry / Pointe Breeze)
Philadelphia is a city of contrasts. On one hand it has started to experience a secular decline, with stagnating population growth and business expansion at the metro-level. But on the other hand certain neighborhoods within Philadelphia are booming, particularly the 19146 ZIP Code in South Philadelphia, which includes the neighborhoods of Greys Ferry and Pointe Breeze.
19146 includes the Greys Ferry and Pointe Breeze neighborhoods in South Philadelphia.
Back in 2011 the Poverty Rate in this ZIP Code was an extremely elevated 30%. Since then the Poverty Rate has been cut in half to 15%, a relatively low level for an urban neighborhood. The result has been less crime and more business expansion.
Meanwhile, the percentage of Wealthy Millennial Households in the ZIP has doubled, going from 12% to 24%. At the same time the college degree rate has shot up from 41% to 58%. The combination of Wealthy Millennial growth plus increases in Bachelor Degree Rate provide a double benefit of increases consumer spending in the local area while also maintaining the neighborhood’s “hipness”.
Home prices in the 19146 have increased by 75% from 2011 to 2021, leaving the typical price at $383k in January 2021. This is a relatively affordable price for the underlying demographic and economic improvement of the area.
Nashville is a growth all-star. Jobs, migration, income, and new businesses – it’s all coming to the Music City. When there is such strong growth at the metro level, that will naturally increase the amount of gentrifying neighborhoods in the city. 37206 in East Nashville is the best example of this.
The Poverty Rate in the ZIP code has declined from 30% to 21% over the last decade, a large reduction. However, the neighborhood is still in its early to mid stages of transition, since a 21% Poverty Rate is still above average.
Back in 2011 East Nashville’s Wealthy Millennial rate was a miniscule 4%. That means that only 4% of the households in the neighborhood were between the ages of 25 and 44 and earning more than $100k per year. Impressively, the Wealthy Millennial Rate has increased by 5x over the last decade to 20%.
Real estate investors have been wise to East Nashville for a while now. Home prices in the ZIP have more than doubled over the last 10 years, increasing from $181k to $404k. This isn’t quite an East Austin level of appreciation, but it is getting there. This likely means that future growth will not be as strong.
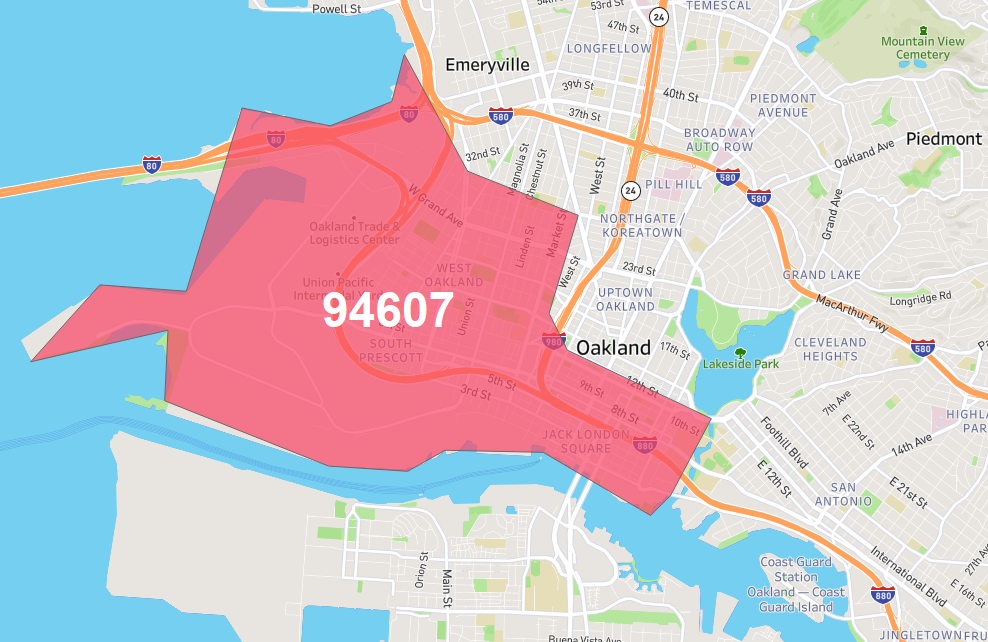
Generally defined as West Oakland, but includes sub-neighborhoods like South Prescott and Lower Bottoms.
Oakland is one of the hallmark examples of gentrification across the country, attracting significant income and wealth spillover from nearby San Francisco over the last decade. 94607, which includes the neighborhoods of West Oakland, South Prescott, and Lower Bottoms, is the biggest beneficiary of this gentrification pattern.
But unlike most other neighborhoods on this list, 94607 is already very expensive. The typical home price is $755k in aggregate and $605 PSF. What’s more, it’s gone by nearly 150% over the last decade.
Color me skeptical that the neighborhood will continue to achieve those growth rates. After all, while the Poverty Rate has declined, it is did so marginally and is still at an elevated level of 24%. The Bachelor Degree rate of 48% is also below average for the set.
Declines in home prices and rents in San Francisco could result in some of the gentrifying residents moving back across the Bay. The region has also experienced a large outflow of residents over the last year.
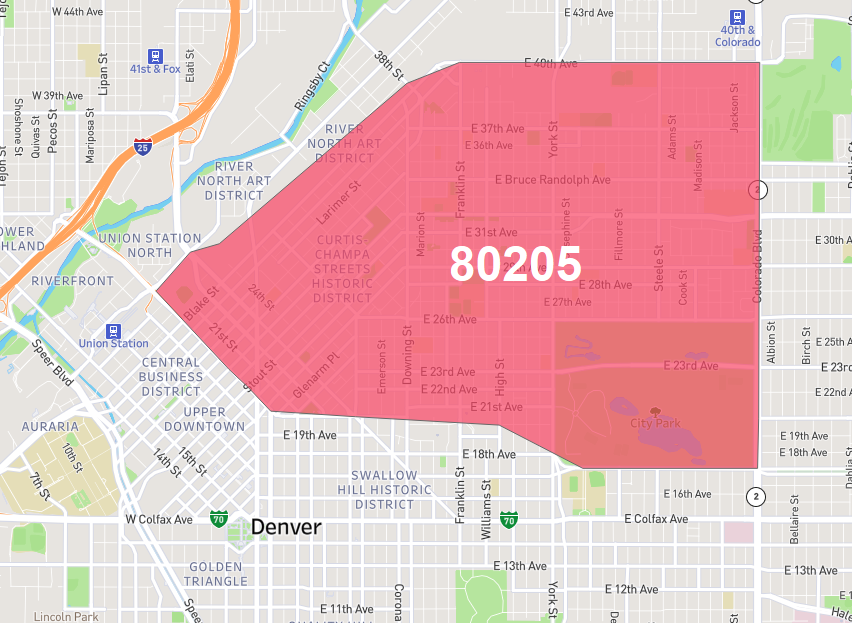
80205 is located on the edge of the River Norths Arts District, otherwise known as RiNo.
Denver is one of the fastest-growing metros in the country, benefitting from a rapidly expanding tech sector and associated in migration from California. The result has been job growth and escalating incomes. No neighborhood has benefitted more than 80205 – the River North Arts District, otherwise known as RiNo.
RiNo, originally known for its hipster and punk roots, has now become the neighborhood of boutique hotels, master-planned developments, and food halls. This capital investment has resulted in the the Wealthy Millennial Rate is approaching 30%, while the Poverty Rate is now comfortably below 20%.
Home prices have followed suit, more than doubling in the last decade from $252k to $545k. That price point is definitely on the higher range compared to neighborhoods with similar Gentrification metrics in Houston, Raleigh, and Philadelphia.
Reventure Consulting uses high-end data analytics and 1-on-1 coaching to advise home buyers and real estate investors on the best locations to buy for future value growth and appreciation. To learn more about how Reventure can help you make more money in real estate submit a contact form today, leaving your name and a brief description about your real estate investment goals.
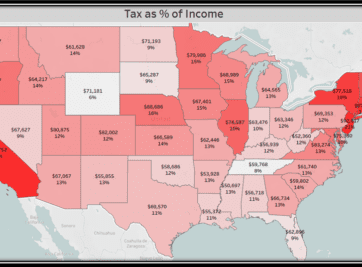
Was Tax Day more of a burden this year than years past? If you’re wondering whether there’s an escape from the inevitability of taxes let us give you the tools to analyze for yourself. Believe me, you’re not alone and not all states are created equal.
Home is where the heart is. Even in this volatile housing market you will always need a place to call home.
Has uncertainty and rising costs made home ownership unaffordable for many Americans? Let us provide some tools and analysis to help you find out for yourself.
The decision to buy or rent can be daunting and hopefully this methodology will help you in this monumental and stressful task. This article is meant to serve as a guide to assist in determining the true cost of home ownership for your situation.
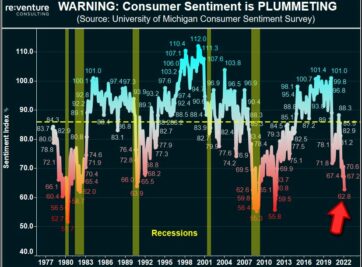
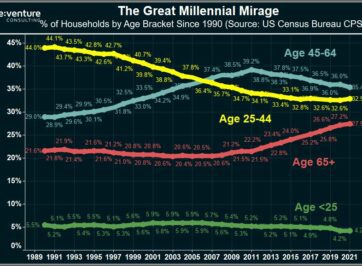
Millennials are supercharging the 2022 Housing Market, right? Wrong according to data from the US Census. In fact, Millennials are BOYCOTTING the Market.
Home Prices are up 20-30% across states like Florida and Texas in 2021. But there’s no growth in the number of people moving there. Is this a colossal bubble?
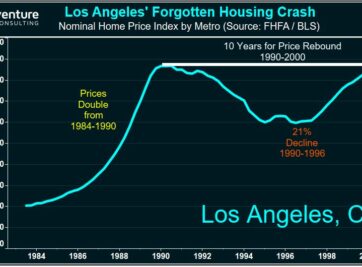
Florida’s Housing Market is BOOMING in 2021. But could the state be heading for another 50% crash in Home Prices? Certain data says that’s a possibility.
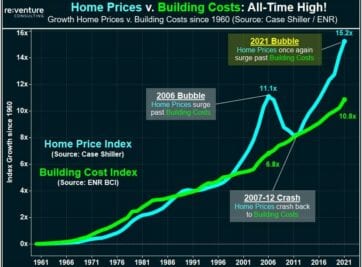
Surging Construction Costs in 2021 are being blamed for the Housing Market Mania being experienced in the US. Yet the data tells a very different story.