Some markets are currently facing a Housing Shortage. Simply put, there is not enough housing being built to accommodate the growing population and income of the market. The result is upward pressure on rents and values, providing higher returns to real estate owners in these markets.
Other markets are facing the opposite situation – a Housing Glut. There is too much housing being built given the levels of growth throughout the economy. These markets will suffer from low rent growth and occupancy issues.
But how does one identify a Housing Shortage from a Glut? That’s one of the most common questions that Reventure Consulting receives from its clients across the real estate industry.
This post will explore the methodology and data that Reventure utilizes to answer this question.
Start with Permits
The best place to start when evaluating a Housing Shortage v. Glut is to analyze permit data. Permits are a great metric to track because they provide 1) historical context and 2) a forward-looking indicator of supply.
The second point is key. Permits pulled today likely won’t turn into completed units for 12-24 months, providing a real-time view into the future supply dynamics of a market.
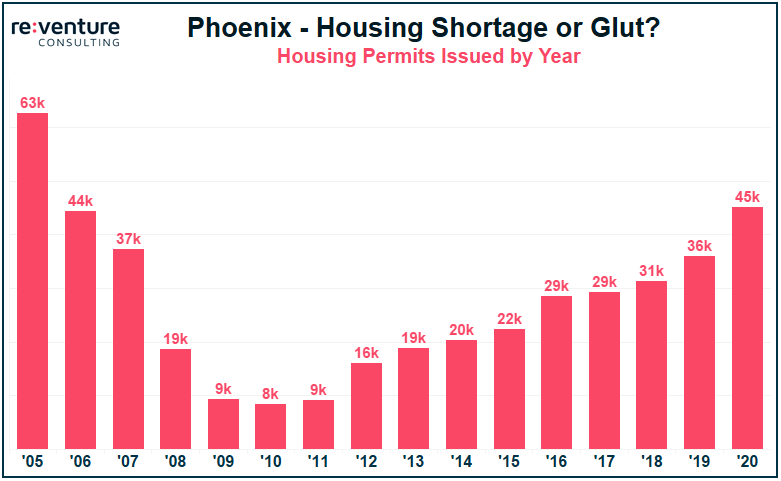
The graph below shows total permits pulled in the Phoenix metro area going back to 2005. What’s immediately evident is how volatile Phoenix-area permitting has been over the last decade and a half. Back in 2005 the metro permitted 63k new housing units, a figure which collapsed to 8k in the depths of the Great Financial Crash in 2010. Since then permitting has slowly built itself back up to the 45k Phoenix is on pace for this year.
The raw permit figures provide some interesting insights. On one hand, it seems like Phoenix might have been experiencing a Housing Glut in the mid-2000s and a Housing Shortage in the early 2010s.
But ultimately it’s hard to make heads or tails of raw permit figures over time. After all, Phoenix’s population and housing needs are significantly higher today than 15 years ago.
How do we turn Permits into a metric that provides apples to apples comparisons over time? That’s where Permit % becomes useful.
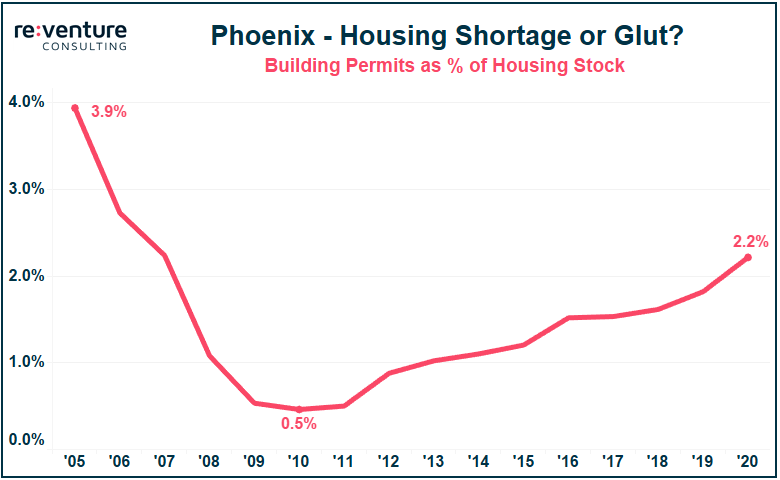
Permit % is calculated by dividing the numbers of permits issued in a given year by the existing housing supply in that year. For example, Phoenix’s 45k permitted units in 2020 are approximately 2.2% of its current housing supply of 2.03 million.
Permit % can be thought of as an indication of supply expansion. So, for instance, 2020’s Permit % shows that a supply expansion of +2.2% was permitted. Back in 2005 Phoenix was permitting a +3.9% expansion of its housing supply.
While Phoenix has increased its permitting significantly over the last five years, on a relative basis it is still well below the Housing Glut levels it experienced in the mid-2000s.
Compare to Other Markets
At this point we know that Phoenix’s current level of permitting is somewhat elevated, but still well below its own historical standards. That’s a useful thing to know.
But what would be even more useful is understanding how Phoenix’s permitting compares against markets around the country. After all – the choice many investors face is not “will I invest?” but rather “where will I invest?”.
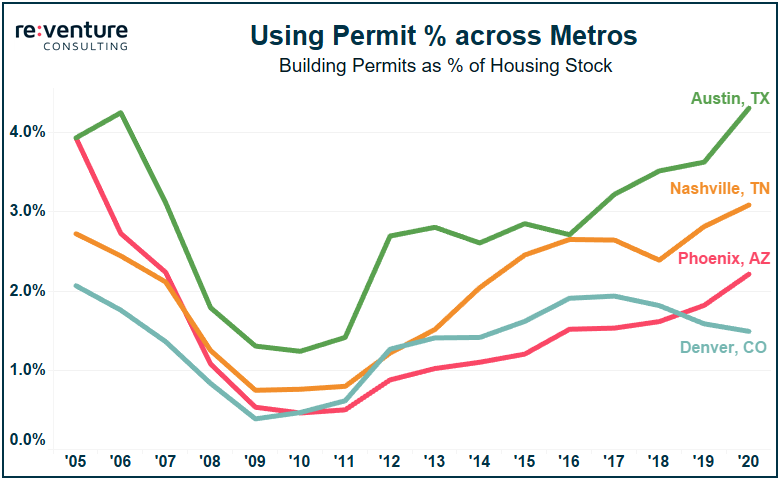
Now we have some real perspective. All of the four growth markets surveyed above have seen a large increase in permitting since 2010. However, Phoenix’s increase looks fairly muted compared to the likes of Austin and Nashville. Interestingly, Denver has actually experienced a decline in new permitting over the last five years, a rarity for high-growth market in the Western US.
What the data above indicates is that Austin and Nashville are likely closer to a Housing Glut than Phoenix and Denver.
Does the Demand Stack Up?
But Permit % doesn’t tell the entire story. We need to know to if demand for housing in a market has increased or decrease in recent years. If demand has gone up, more permitting is justified. If demand has gone down, then more permitting could spell major trouble for the real estate market.
The best indication of demand is Household Formation. That is, the number of new households being formed across a metro in a given year. Household Formation is the indicator most tied to true housing demand. Something like Population Growth, on the other hand, is more of an indirect measure (e.g., if a family welcomes their second child, that will increase the population, but it won’t have much of an impact on housing demand).
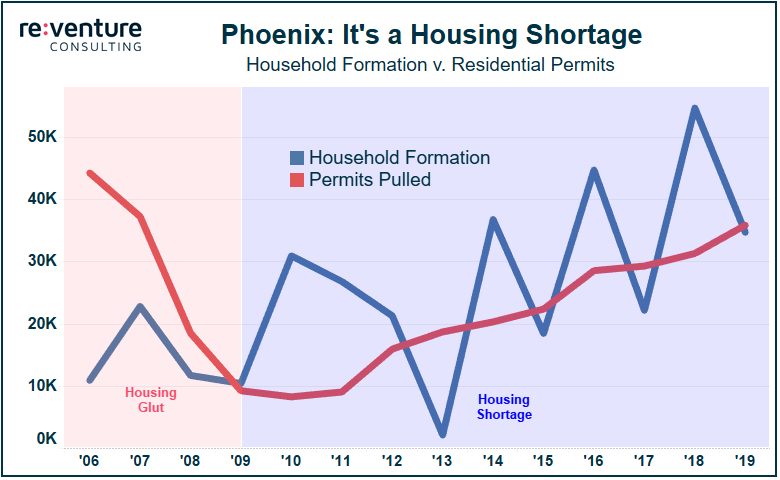
The way to interpret the graph below is as follows:
Blue Line > Red Line: Shortage
Red Line > Blue Line: Glut
Phoenix was clearly suffering from a Housing Glut in the mid-2000s, as new permitting far outstripped new Household Formation. But the tide turned in 2010. New permits fells just as Household Formation started picking up steam. And for a majority of the subsequent decade new demand outstripped supply, with Household Formation exceeding Permitting by over 40k. That’s the definition of a Housing Shortage.
The Consequences
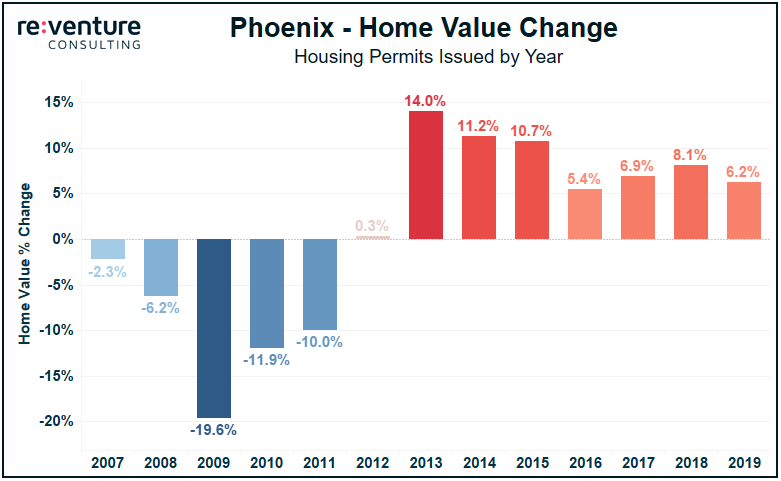
What do the consequences of a Housing Glut v. Shortage look like for real estate investors? One look at Phoenix’s home value chart tells the story.
From the late 2000s to the early 2010s Phoenix’s median home value declined by an average of 10% per year, or nearly 50% in aggregate. Many investors got wiped out, and the ones who didn’t needed to inject serious amounts of equity into their projects to stay afloat. These are the consequences of a Housing Glut.
But the real estate growth Phoenix has experienced over the last six to seven years show the fruits of a Housing Shortage for real estate owners, with value appreciation comfortably above 5% per year. Phoenix’s Housing Shortage has also resulted in superior returns over the last 12 months, even in the midst of a pandemic and recession.
As a result, understanding the whether your market is facing a Housing Glut or Housing Shortage is of paramount importance for real estate investors.
Reventure Consulting uses high-end data analytics to advise real estate owners, developers, and lenders on their investment strategy. Reach out today to learn more about how Reventure can help you achieve better returns.