Successful real estate investment is all about finding neighborhoods in the early stages of growth. The sweet spot is a neighborhood that has already experienced some positive movement but remains under the radar of most investors. This will allow for an affordable acquisition basis with plenty of meat on the bone for appreciation.
Finding these neighborhoods – let’s call them “unicorns” – is easier said than done. Real estate is an extremely competitive industry with both institutional and local investors all on the lookout for unicorns. As soon as word gets out, capital will flood into the area and prices bid up. At that point, the neighborhood shifts from unicorn to “discovered” status.
Fortunately, there are some metrics out there that can help discerning investors spot a neighborhood still in its unicorn stage. Today we’ll discuss arguably the most important one: household income.
At this point, it’s important to ask: what is the fundamental driver of real estate values?
Many brokers and investors discuss the attractiveness of a neighborhood in terms of a variety of characteristics. Safety, school districts, convenience, shopping, and nightlife are several common discussion points. While these factors all impact the real estate values in a given neighborhood, they each result from one common source: household income.
For instance, one of the best cures for crime is income. Moreover, the best school districts are in high-income neighborhoods. Retailers opening new grocery stores, restaurants, and shops target locations with high incomes. And let’s not forget another important factor: households with higher incomes can afford higher rent and mortgage payments.
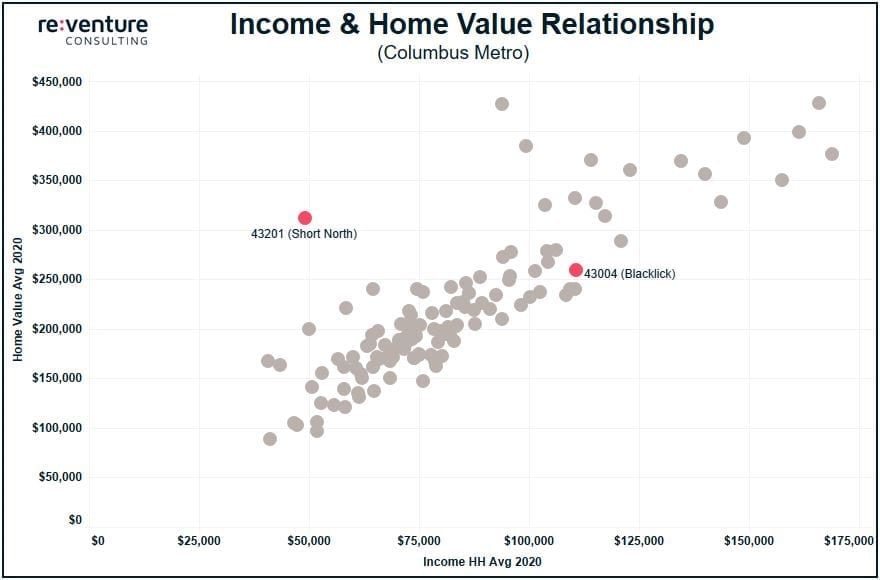
As a result, neighborhoods with high incomes have higher real estate values. This relationship can be observed in the graph below, which plots average household income and home value for every Zip Code within the Columbus, OH metro area.
The relationship is very robust, with an r2 of 0.73 (indicating that variations in household income levels explain 73% of the variation in home values).
But if income levels are already such a strong predictor of home values, how can they be used to find unicorn neighborhoods? Aren’t high-income neighborhoods already discovered?
Most are. But some aren’t.
Let’s go back to the graph above, but call out two specific Zip Codes: 43201 (Short North) and 43004 (Blacklick). Short North’s average home value is $311k, over 20% higher than Blacklick’s $260k. Yet the income levels tell a separate story.
The average household income in Blacklick is $111k, more than double the $49k in Short North. Yet Blacklick’s home values are considerably lower. This means that values in the Short North are over 6x higher than underlying household incomes, while Blacklick’s ratio is around 2x.
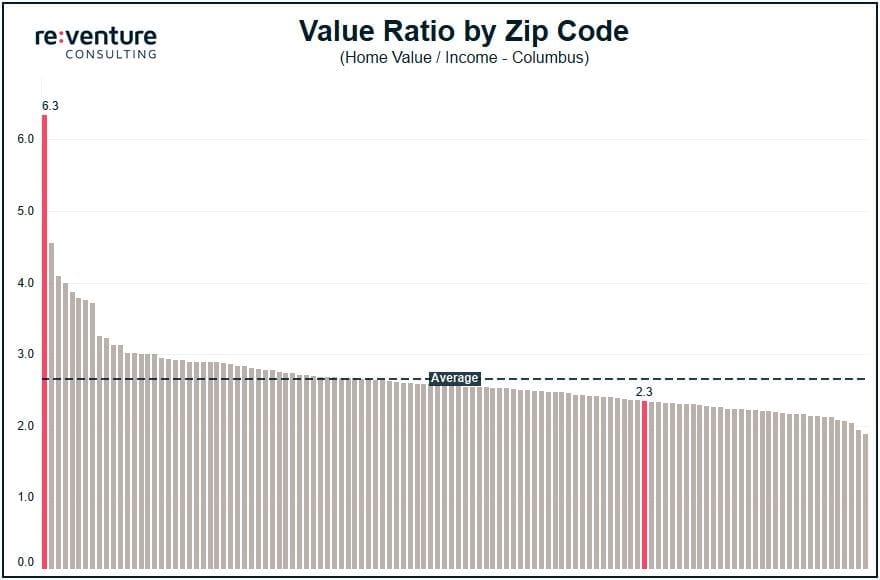
The ratio of home values to incomes (“Value Ratio“) serves as a good barometer for how over or underpriced a neighborhood is. The higher the Value Ratio, the more the neighborhood stretches budgets and prices residents out. The lower the Value Ratio, the more affordable the neighborhood and room to grow.
This is not to say that Short North isn’t a good area. It’s quite the opposite – the Short North is the most bustling neighborhood in Columbus. Value Ratio simply shows that Short North prices are “fully baked” and unlikely to increase significantly without large increases in the underlying incomes of its residents (which could happen – the Short North ranks highly on some other metrics, like educational attainment, that could be predictive of future income growth). Meanwhile, Blacklick’s real estate values have plenty of room to grow as the high incomes of its population magnetically attract new investment.
Across Columbus, the average Zip Code has a Value Ratio of 2.7 (meaning that the average home value is 2.7x the average household income). The neighborhoods that have the highest unicorn probability, including Blacklick and its Value Ratio of 2.3, are located below the dotted line. Investors – whether they be a first-time homebuyer or a multifamily investment company – will likely experience better returns targeting these neighborhoods.
A visual representation of these neighborhoods across Columbus is below. The greener the cell, the lower the Value Ratio, and the better the investment appreciation potential. Vice versa for the bluer shaded cells.
Household income is the fundamental driver of real estate, explaining nearly 75% of the variation in home values across different neighborhoods. However, certain neighborhoods can present significant appreciation potential if home values haven’t yet caught up with the underlying incomes. These are the potential unicorns investors should target to achieve the best appreciation prospects.
But there’s more to the story than just income levels. Growth momentum, population density, and educational attainment are other key factors that influence real estate values. Stay tuned for exploration of these factors in future posts.
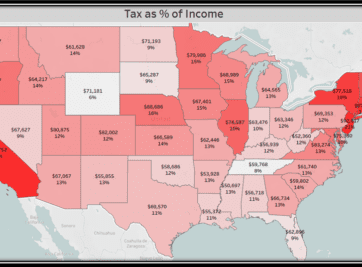
Was Tax Day more of a burden this year than years past? If you’re wondering whether there’s an escape from the inevitability of taxes let us give you the tools to analyze for yourself. Believe me, you’re not alone and not all states are created equal.
Home is where the heart is. Even in this volatile housing market you will always need a place to call home.
Has uncertainty and rising costs made home ownership unaffordable for many Americans? Let us provide some tools and analysis to help you find out for yourself.
The decision to buy or rent can be daunting and hopefully this methodology will help you in this monumental and stressful task. This article is meant to serve as a guide to assist in determining the true cost of home ownership for your situation.
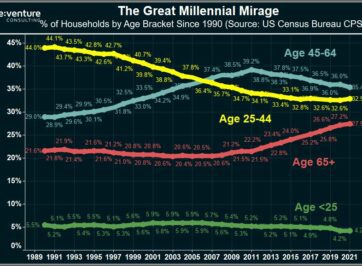
Millennials are supercharging the 2022 Housing Market, right? Wrong according to data from the US Census. In fact, Millennials are BOYCOTTING the Market.
Home Prices are up 20-30% across states like Florida and Texas in 2021. But there’s no growth in the number of people moving there. Is this a colossal bubble?
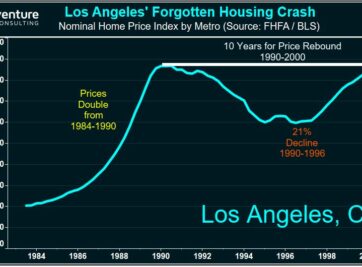
Florida’s Housing Market is BOOMING in 2021. But could the state be heading for another 50% crash in Home Prices? Certain data says that’s a possibility.
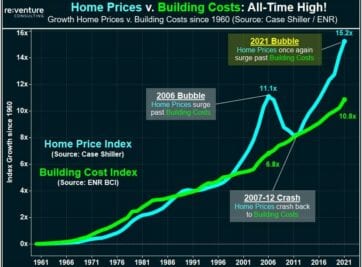
Surging Construction Costs in 2021 are being blamed for the Housing Market Mania being experienced in the US. Yet the data tells a very different story.